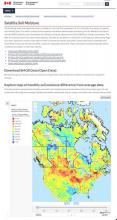
The following maps and data show levels of moisture in the top five centimeters of soil in Canada on a weekly, bi-weekly and monthly basis. The data is produced from passive microwave satellite data collected by the Soil Moisture and Ocean Salinity (SMOS) satellite and converted to soil moisture using the latest version of the SMOS soil moisture processor. The data are produced by the European Space Agency. The data are gridded to a resolution of 0.25 degrees. Data quality flags have been applied to remove areas where rainfall is present during the acquisition, where snow cover is detected and when Radio Frequency Interference (RFI) is above an acceptable threshold. These information products highlight where conditions are wetter or drier than normal.
- agriculture
- soil
- moisture
- farming
Did you find this app useful?
32 votes with an average of 2.70